artifacts
thoughts and things I've learned along the way 👋
Two realities
Originally posted: 12/06/20
Paradoxically, mathematical reality exists independently of us and it is our role to uncover and observe it.
I will use the noun intuition to denote the ability to understand an idea without the need for conscious reasoning.
The adjective real in the same sense that you can think about the material world with respect to day and night, or a super blood wolf moon. It is outside, independent of us.
I will define the noun reality with two separate connotations, physical reality and artificial reality.
By using the adjective physical I mean the reality that you and I inhabit. The same reality that physicists try to describe using mathematics.
Then we have the adjective artificial which will be referred to in its ordinary sense, “Made or produced by human beings rather than occurring naturally, especially as a copy of something natural”.
The connotations between the physical and artificial states ring true in the world of machine learning optimization, in the sense that the physical and artificial realities coexist.
The role of visualization in data science can be a very broad topic[1], usually lending itself to a graph that explains a descriptive business metric…

…or some goal centered around a base of statistics relevant to a business problem that will influence a decision making process.

But I find that in a machine learning research environment, plotting something like the convexity or non-convexity of a loss function…

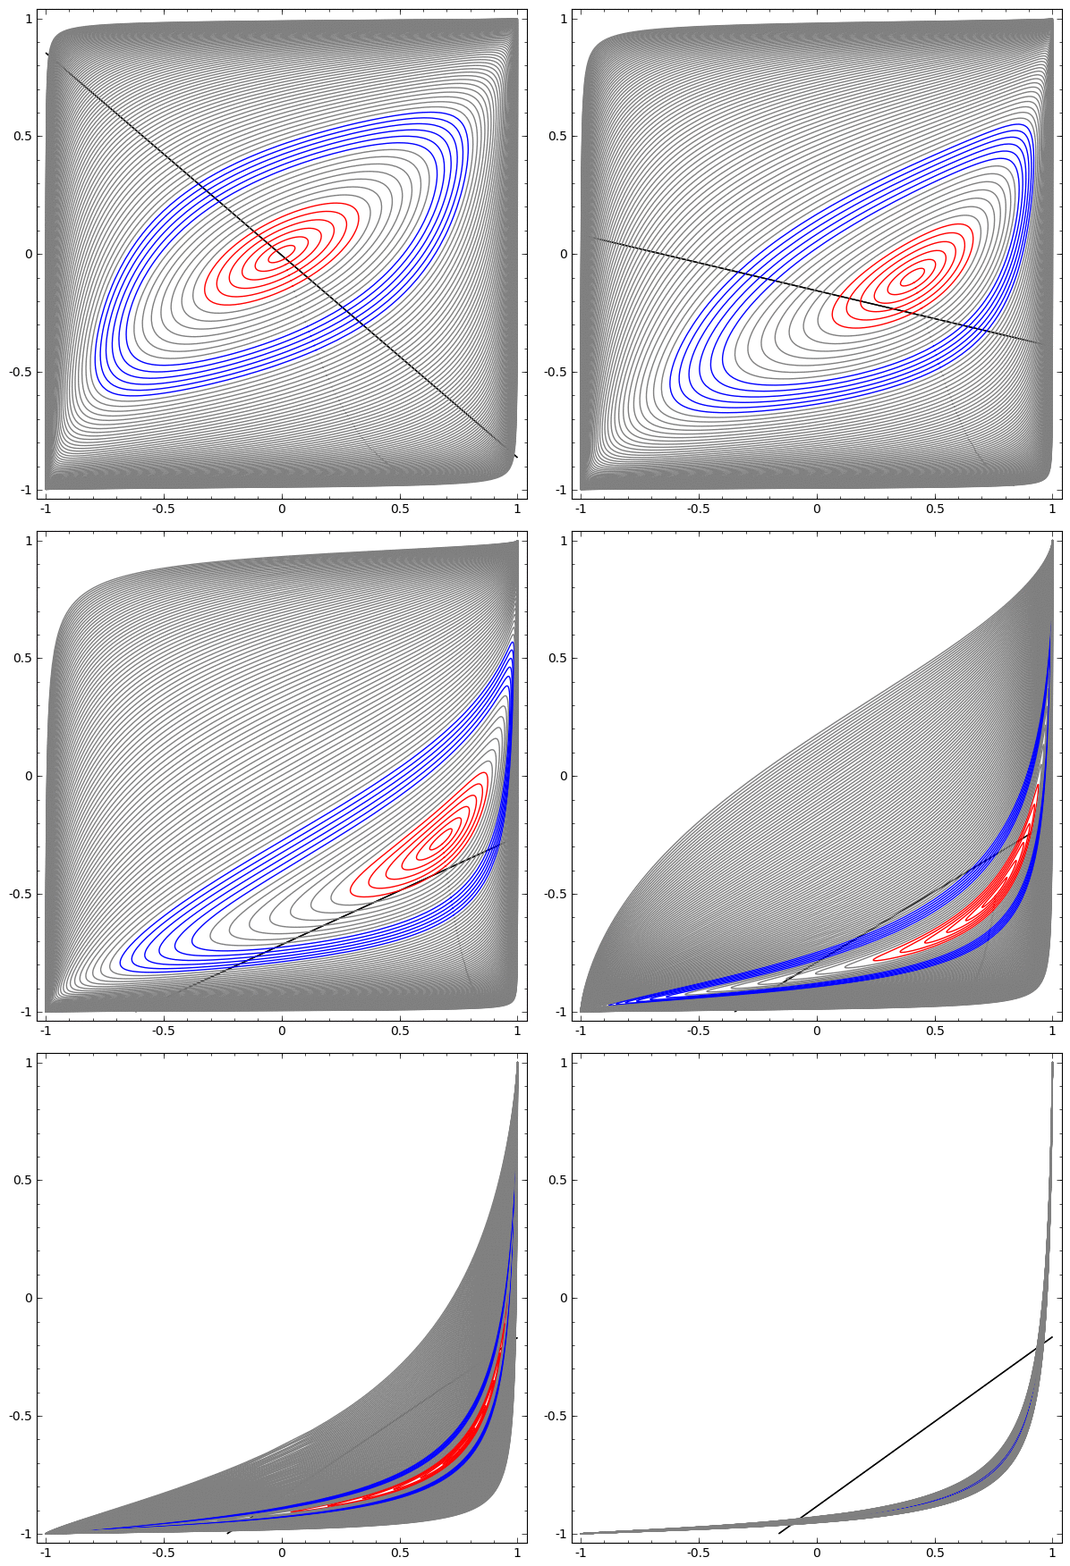
…or the hidden representation of a neural network trying to learn a predictive classification task…

…serves a different purpose. It is not a true representation of anything in the physical world. It is a virtual, or simulated reality used to understand the abstract nature of a concept, theorem, data, or even a reinforcement learning agent.
Metaphorically speaking, the function of a visualization exists to stimulate the imagination. They literally aid in the ability to understand concepts both practical and abstract, but the truth of a theorem is not affected by the quality of the visualization, as it is a tool to make the meaning of the function easier to understand. This is to say in some sense, that what you see is not real.
For example, let’s look to the major branch of mathematics known as topology. It has many practical applications that help us solve real non-trivial problems, such as the mobius strip[2]…

…being used as a belt for a conveyor in the 1950s.

The belt being used for the conveyer is a part of the real world. Suppose the conveyor is being used in some sort of mining task where the typical conveyer belt lifespan is dependent on top cover wear and cut damage. The mobius strip belt handles this elegantly, as the middle half twist in the belt allows the belts surface area to wear equally.
Let’s say the belt for whatever reason breaks. The theorem defining the existence of the mobius strip, does it change because its physical representation is destroyed? The mobius strip exists independently of the belt whose design is based on the theory and is further independent of any other detail of the real world. The inverse is also true.
As illustrated in the gif above, topology applied to data and neural networks is a very abstract model as opposed to its representation of physical reality. For example, the concrete application of homeomorphisms as applied to problems concerning large data sets, tries to describe global features of a space dependent on the data contained within the space locally[3].
Given the connection between data, neural networks and topology, visualizations like the gif above open a door in helping us to understand what a neural network is really doing when its trying to approximate a representation. This helps to deepen our intuition regarding feature spaces, high/low dimensional qualities of data and latent structures in large datasets[4].
In the absence of a visualization or intuitive illustration, describing something like gradient descent would be tricky. As its visual, physical representation are just real numbers starting with some very high value and descending through time until it reaches some optimal value…

A number of popular illustrations regarding this process denotes a mountain (parameter space) by which someone (a gradient) must descend (find the location in the parameter space where the badness of fit is minimized and the goodness of fit is maximized) and the time it takes her to get to the bottom (where the function fits the data best).
This illustration of gradient descent is important to us because of the parallel drawn from its physical representation and it allows us to gain insight into the idea without the frame of conjecture. This simple pose allows the intuition for gradient descent to take many forms:

The geometry of the loss landscape is actually more complex than this, and represents many "canyons" and "valleys".
These philosophical implications even ring true for the hairy ball theorem.
As I try to organize some of my high level thoughts on the role that visualization plays in understanding how computers learn, one thing is certain. The rich connection between distilling data into something useful and trying to understand the abstractions of learning machines is something that will continually spark my enthusiasm for artificial intelligence.
Things like neural ordinary differential equations, optimization algorithm development, statistical learning methods, machine learning interpretability, and safety are some of the topics at the forefront of researchers minds today, and tied to the mathematics and theory of every paper will be a map leading us from the abstract to something that we can understand.
References:
Vellido, Martin, Rossi, Lisboa. Seeing is Believing: The Importance of Visualization in real-world machine learning applications. 2011.[1]
Weisstein. Möbius Strip. 2020.[2]
Olah. Neural Networks, Manifolds and Topology. 2014.[3]
Ghrist. Three Examples of Applied and Computational Homology. 2008.[4]